Overview of Ecommerce Statistics: Global Retail E-Commerce Sales 2014-2021
Ecommerce Statistics: Global Retail E-Commerce Sales 2014-2021

The Global Economic Sales touched the magical number of 3 trillion US dollars in the year 2018. The e-commerce wing has become one of the business fields that delivered most of its share and continues to generate more business in the coming years. Every passing year, e-commerce does something new and continues to stand at the brightest side of the market.
Investors positively look forward to the e-commerce field, hoping to reap more profits, which is very much possible if we look into the statistical information. Let us drive through some of the statistical data and find out what exactly is happening in Global Retail E-Commerce Sales 2014-2021.
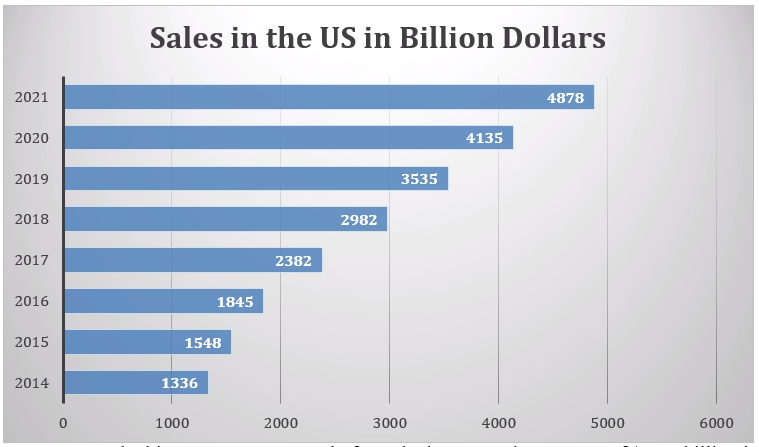
- In the year 2017, the total revenue of the top 3 online stores was 100 billion US dollars.
- Amazon, the biggest e-commerce platform, had generated a revenue of $88.9 billion in 2014 and has been projected to touch the envious number of $316 billion in the year 2021.
Online shopping in different regions:
Online shopping is one of the most trending activities across the globe; however, the figures change with the change in the region. For example, China has done approximately 19 percent of retail sales via the internet in the year 2016. In the same year, Japan did only 6.7 percent of retail sales. With this, we can say that the shopping stats and its popularity change with the region.
Facts and figures:
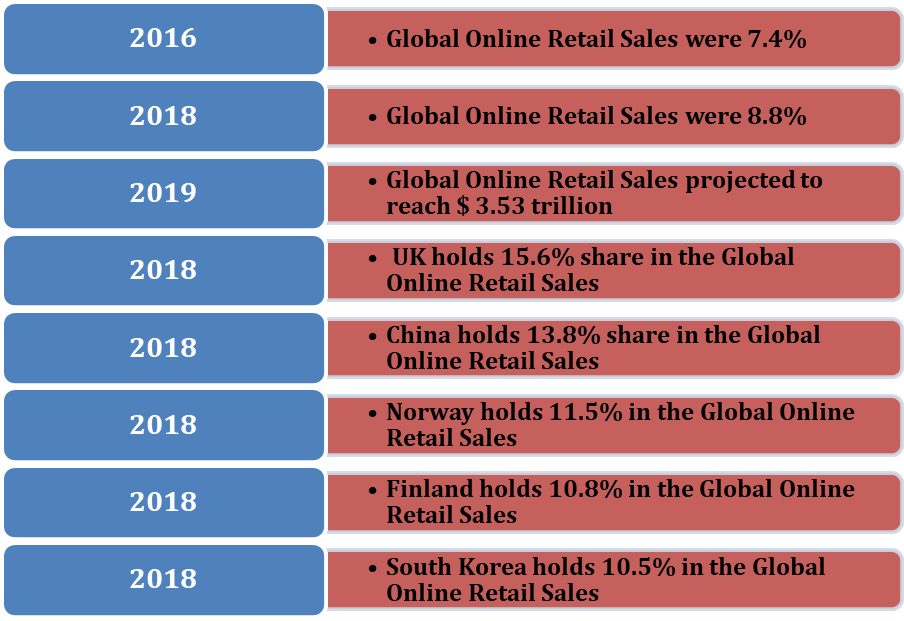
● Global Online Retail Sales were 7.4% in the year 2016, and it reached 8.8% in 2018.
● The UK holds 15.6%, the highest Retail E-Commerce Sales percentage of total retail sales.
● China is next on the list, with 13.8% of total E-Commerce Retail Sales.
● Up next is Norway, with 11.5% of total E-Commerce Retail Sales.
● Then comes Finland with 10.8% of total E-Commerce Retail Sales.
● South Korea is the next one in the list, with 10.5% of total E-Commerce Retail Sales.
Percentage Of International Web Traffic With The Average Number Of Languages Per Webshop:
The below stats show the changes in the heights of the bars with the increase in the number of online shopping site’s language availability between the years 2014 to 2021.
Facts and figures:
● Webshop available in only one language has 5.09% of international web traffic.
● Webshop available in two languages has 10.77% of international web traffic.
● Now, the Webshop available in 4 languages (on an average) has 25.38% of international web traffic.
Online shopping on different devices:
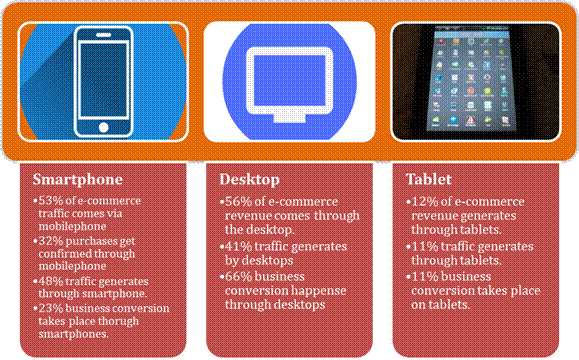
When it comes to shopping online, desktop PCs are still much more popular than mobile phones. However, modern smartphones are rapidly catching up with the leaders. People have started using these small and portable devices more than ever to satisfy their shopping experience.
Facts and figures
● Around 53% of e-commerce traffic comes via mobile devices, but only 32% of the customer mark any purchase.
● As per the stats of 2018, 56% of e-commerce revenue comes through the desktop.
● Next in the list is the purchase via mobile phones, which makes 32% of total revenue.
● Last is via tablets, which is 12% revenue.
● Desktop gives traffic of 41%, and the conversation percentage is 66%, which makes desktop top the list.
● The next one is Mobiles with 48% of traffic and conversion percentage of 23%.
● Last in the list is tablets with 11% of traffic and the same percent of conversation percentage.
Shopping categories worldwide:
In this segment, we will have the information regarding the most popular types in the Global Retail e-Commerce Sales 2014-2021.
Facts and figures:
· As per the stats of 2018, the United States of America has more than 258.9 million digital buyers.
· The first position is going to the apparels’ category, which makes 57% of Global Retail E-Commerce Sales 2014-2021
· The next one in the list is footwear, which has acquired 47 percent of online purchases.
· Food and beverages with 12.7% CAGR are rapidly growing, with an average growth of 8.7%.
· As per the American Customer Satisfaction Index, aka ACSI, online retail, scored 82 out of 100 points in the customer satisfaction charts.
· In the year 2019, Amazon also saved 82 points out of 100 in the customer satisfaction category.
The top 10 countries that are spending money online:
With the increase in e-commerce and digital transitions, a lot of countries have started welcoming it with open arms. Countries like China and the US are first and second, respectively, in the list of top 10 countries that are spending money online. Followed by the UK, Japan, and Germany.
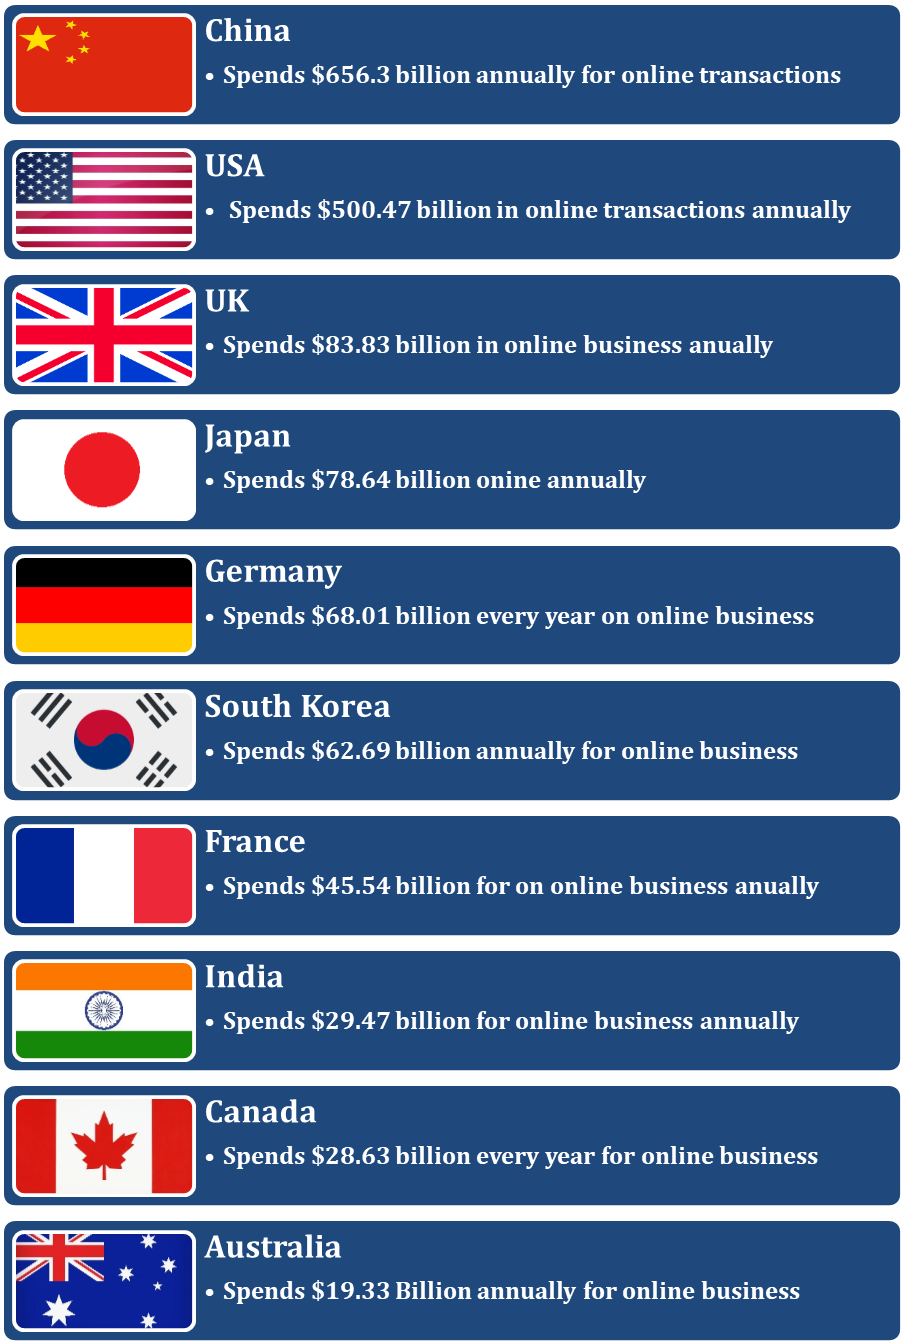
Figure and figures:
· As per the stats, China is spending $656.3 billion annually for online transactions.
· The United States of America is second in the list, with $500.47 billion in online transactions.
· Next on the list is the United Kingdom, which spends $83.83 billion in online business.
· Japan, on the other hand, spends $78.64 billion online annually.
· Next is Germany, which spends $68.01 billion every year on online business.
· In the list of countries spending only money, next we have South Korea with a spending of $62.69 billion.
· France spends $45.54 billion on online money.
· Then comes India with a spending of $29.47 billion.
· Next is Canada, which spends $28.63 billion every year of online money.
· In the tenth and last position, we have Australia, with $19.33 Billion spendings.
Global digital buyers:
Buying and selling of goods online have become pretty much common these days. With the impact of online shopping, the e-commerce industry has gained a boost. People prefer going online because they can order whatever they want, sitting at the comfort of their home. The next vital reasons for purchasing online goods are people believe that they can get competitive online pricing rather than traditional shopping.
Facts and figures:
· The US has topped the list in the category of leading online retail markets in 2016.
· The stats show 1.66 billion global digital buyers in the year 2016.
· The forecasting shows tremendous growth in online shopping, and it may cross over 2.14 billion people worldwide in the year 2021.
· With desktops, buyers have made an online order of US $143.35 million in the year 2016.
· In the same year, tablet users placed an online order of US $106.98.
· PayPal has come as the most preferred payment mode, with around 40% of online shoppers using it to make payment while shopping through various e-commerce websites.
· On the same list, credit card stands at the 2nd position, with more than 31% of people using the same to make a payment online.
Worldwide retail e-commerce sales growth:
If we look into the figures and projections from the year 2014 to 2021, it shows a significant uptrend, which makes Retail Ecommerce Sales one of the fastest-growing industries across the globe.
Facts and figures:
· In the year 2018, Retail E-Commerce Sales were 12.2% of global retail sales.
· Global E-Retail Sales grew by 22.8% in 2018 as compared to 2017.
Digital shoppers global retail e-commerce sales 2014-2021
Every year Digital E-Commerce is experiencing continuous growth in the field of digital payments.
Facts and figures:
· In the year 2016, the average annual online shopping transaction across the globe was 22.1 per capita in Asia.
· In the year 2016, the average annual online shopping transaction was 19 per capita in North America.
· The total Global online shopper conversion rate is 2.72% as of 2019.
· The Global online shopper conversion rate via iOS is 2.15% as of Q1 2019.
· Clothing is the most popular online shopping category worldwide.
· China has the highest online shopping penetration rate as of 2017.
Mobile Retail Global Retail E-Commerce Sales 2014-2021:
With the increase in smartphone usage, online shopping for utilities and digital payments have also increased. With its portability and ease of use, the mobile phone has become a vital device for customers to shop online.
Facts and figures:
· As of August 2016, the most popular mobile purchase channels of mobile shoppers worldwide are the Retailer Website or App.
· As of 2016, the share of mobile retail transactions via a browser was 54%.
· As of March 2016, mobile shopping penetration in Europe was 32%.
· As of the year 2016, the share of mobile retail transactions via the app was 46%.
Holiday season global retail e-commerce sales 2014-2021:
In the US, the festive season begins on Black Friday for Christmas. In fact, Thanksgiving Day is also an excellent time for the buyer to shop online. Retailers tend to promote their products during these days, and online shopping is the best way to buy the required products within the comfort of sitting at your home.
Facts and figures:
· In 2018, the retail e-commerce spending during the holiday season in the US was $123.7 billion.
· It was the heights ever spent online on Cyber Monday.
· In the year 2018, online spending went to $7.9 billion.
· 30% of the holiday season e-commerce revenue comes from the Smartphone.
· In the year 2018, the U.S. holiday season digital retail e-commerce sales earned $80.22bn.
· In the year 2017, the desktop retail e-commerce sales during the holiday season in the U.S. were $72.3bn.
· In the year 2019, the desktop retail e-commerce sales in the U.S. were $64.29bn.
Interesting statistics global retail e-commerce sales 2014-2021:
Undoubtedly, e-commerce is a field with immense revenue opportunities and possibilities. There are some facts about global retail e-commerce, which makes it even more exciting.
Facts and figures:
· Of global retail sales, 11.9 percent came from online purchases.
· China is the world’s top e-commerce market.
· The United States and China together make more than half of the total worldwide online sales, i.e., $1.3 trillion.
· Amazon is the largest e-commerce company, which is a US-based entity.
· Another two companies on the list are Jingdong and Alibaba, respectively, from China.
· eBay of the United States is fourth on the list.
· The fifth company on the list is Rakuten in Japan.
· The United States and China are the countries that have 4 out of 5 top e-commerce companies across the globe.
Key Performance Indicators:
Key Performance Indicators (KPIs) plays a vital role in the success of online retail. By keeping a keen eye on the KPI stats, entrepreneurs can identify progress in marketing, sales, and customer satisfaction. A business with good KPI can consider as smart and profitable business.
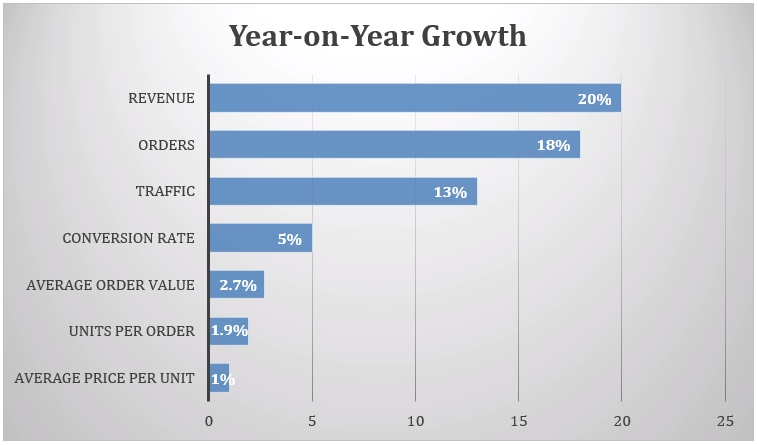
Year-on-Year growth of e-commerce Key Performance Indicators (KPIs) of online retailers and brands worldwide as of 1st half of 2018.
Projected Global Retail E-Commerce Sales 2021:
● Global E-commerce Retail Sales to hit $4.9 trillion by 2021.
● By 2021, e-commerce will represent 11% of retail sales in Western Europe.
● As per the projections, e-commerce businesses will show a 265% growth rate, from $1.3 trillion in the year 2014 to $4.9 trillion in the year 2021.
● Africa and the Middle East will have slow growth in 2021 as per the forecasting.
● By the year 2021, Global E-Commerce Sales will be 17.5% of the total Global Retail Sales.
● eMarketer is expected to have good growth through the year 2021, and the sales will reach US$28tn.
● E-commerce sales are predicted to grow at a rate of 15% in the UK, which is faster than in other Western European countries in the 2017-2021 periods.
● By the year 2021, in the US alone, B2B E-Commerce Sales are anticipated to gain 1.184 trillion dollars.
● E-commerce’s share of retail sales will continue to be low, reaching only 5% by 2021.
● As per eMarketer’s forecast, Double-digit growth will continue until 2021.
● By the year 2021, Asia Pacific forecast to account for two-thirds of global E-commerce.
Regional E-Commerce Sales share of Global E-Commerce was 32% in the year 2010 for the Asia Pacific. It became 60% in 2017 and is expected to reach 67% in 2021.
Regional E-Commerce Sales share of Global E-Commerce was 39% in the year 2010 for North America. It became 21% in 2017 and is expected to reach 18% in 2021.
Regional E-Commerce Sales share of Global E-Commerce was 26% in the year 2010 for Western Europe. It became 15% in 2017 and is expected to reach 10% in 2021.
Conclusion:
The development since 2014 and the projections for 2021 shows excellent growth potential for Global Retail E-Commerce Sales. As more and more people utilize digital online technologies, especially using mobile-based shopping apps, there is no doubt that the sales revenue even may surpass the forecasting. Our future shall depend much on digital marketing, online shopping, and the growth of e-commerce is poised to remain accelerated.
Source:
https://www.google.com/amp/s/2muchcoffee.com/blog/ecommerce-definition-history-statistics/amp/
https://www.spaceshopcommerce.com/blog/top-ecommerce-stats-for-2020
https://www.oberlo.in/statistics/global-ecommerce-sales
https://www.statista.com/statistics/379046/worldwide-retail-e-commerce-sales/
More To Explore
Wearable Statistics And Facts For 2021
Industry report Overview of Wearable Statistics And Facts For 20211
Facebook live Statistics, Usage And Facts (2020 Report)
Industry report Overview of Facebook live Statistics, Usage And Facts
Web Hosting Statistics, Market share And Facts For 2021
Industry report Overview of Web Hosting Statistics, Market share And
Explore Related reccomendations
Mobile Vs Desktop Internet Usage Statistics 2021
- According to 0 users
Etsy Statistics, Users, Usage, Demographics (2021 Report)
- According to 0 users
Groupon Statistics, Users And Facts For 2021
- According to 0 users
Amazon Statistics, Sales Figures (2020 report)
- According to 0 users


